
Tracking Speed to Lead – The Performance Report
Response time to new leads is incredibly important to close sales. Now you can track your SMS reply times to measure and improve conversion.
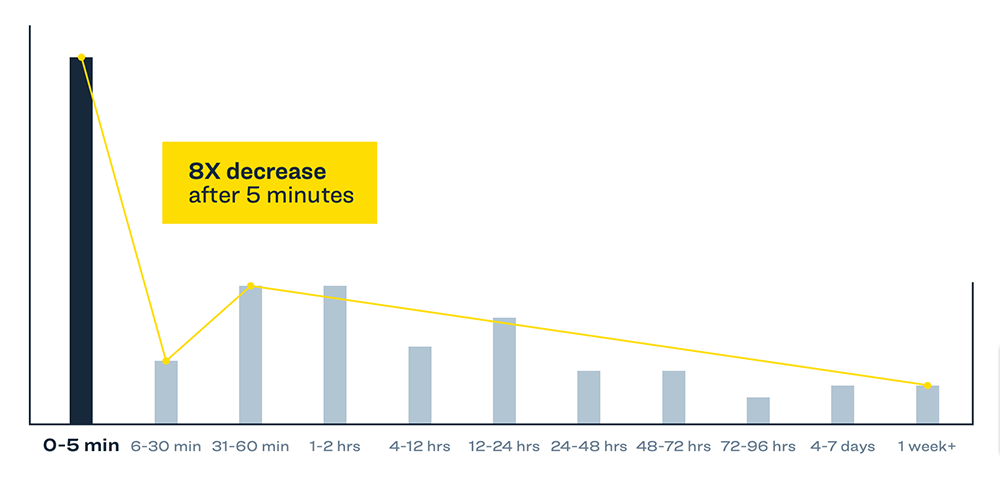
Research proves the faster you respond to a lead, the more likely you are to qualify that lead and convert them into a customer. One survey analyzing over 5 million inbound leads found that conversion rates are 8x greater when you respond within 5 minutes to a new lead. That’s a huge lift you don’t want to miss out on.
Seems simple, yet many businesses really struggle with their response times. A Harvard Business Review study showed that only 37% of businesses respond to leads within an hour.
Part of the battle is making sure you are using communication channels that are faster and easier to use for consumers and your team. That’s text messaging and other messaging channels over contact forms and voicemails.
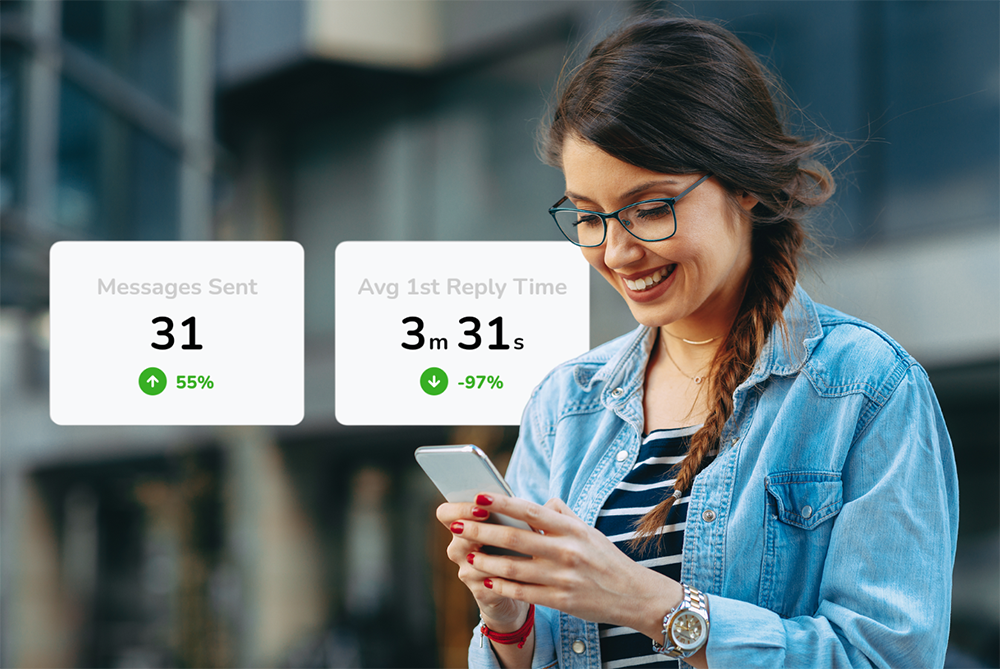
The other part is your speed to lead, how fast you respond to your new leads. Do you know how you are doing with your SMS response times? Now you can by tracking it.
Our latest addition to Leadferno is the Performance Report which tracks and reports your first reply times, average reply times, lead outcomes, and more lead engagement metrics. Best of all, this data is available at the account level and all the way down to the performance of each team member in the app.
Now you can measure your speed to lead so you can improve your text messaging response rates and closed leads.
Note: The Performance Report displays data up to the last complete full day.
Introducing the Performance Report
While our existing Lead Capture Report is focused on the quantity of leads and their sources, the Performance Report is focused on quality. It’s focused the response times and outcomes of your leads to know how your team and company is doing and progressing.
You can access the Performance Report in the web app under Reports > Performance.
Now that you’ve seen the overall view of the Performance Report, let’s break down the features, data, and sections in it. Let’s start from the top and move down.
Filter and date range
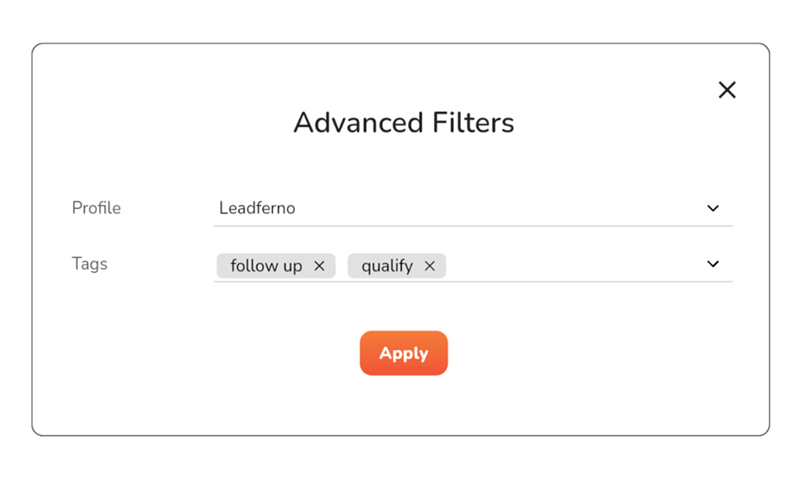
In the upper right of the screen there are buttons to filter your report or change the date range.

The filter allows you to filter the report by the Profile(s) you are viewing and by specific tags. If your account contains multiple profiles (locations or departments) it will apply the filter of the profile you are in, but can be changed.
You can also filter the report by Tags, one or more.
Once you have applied a filter(s), the filter button will show how many filters you have applied.
The date range allows you to change the dates of the report data displayed. The default of the report is the last 30 days, but you also have 7 day, 90 day, and custom date range as an option.
Note: The Performance Report displays data within 24 hours, so the data is not live or current to the day you are pulling it until the last completed day.
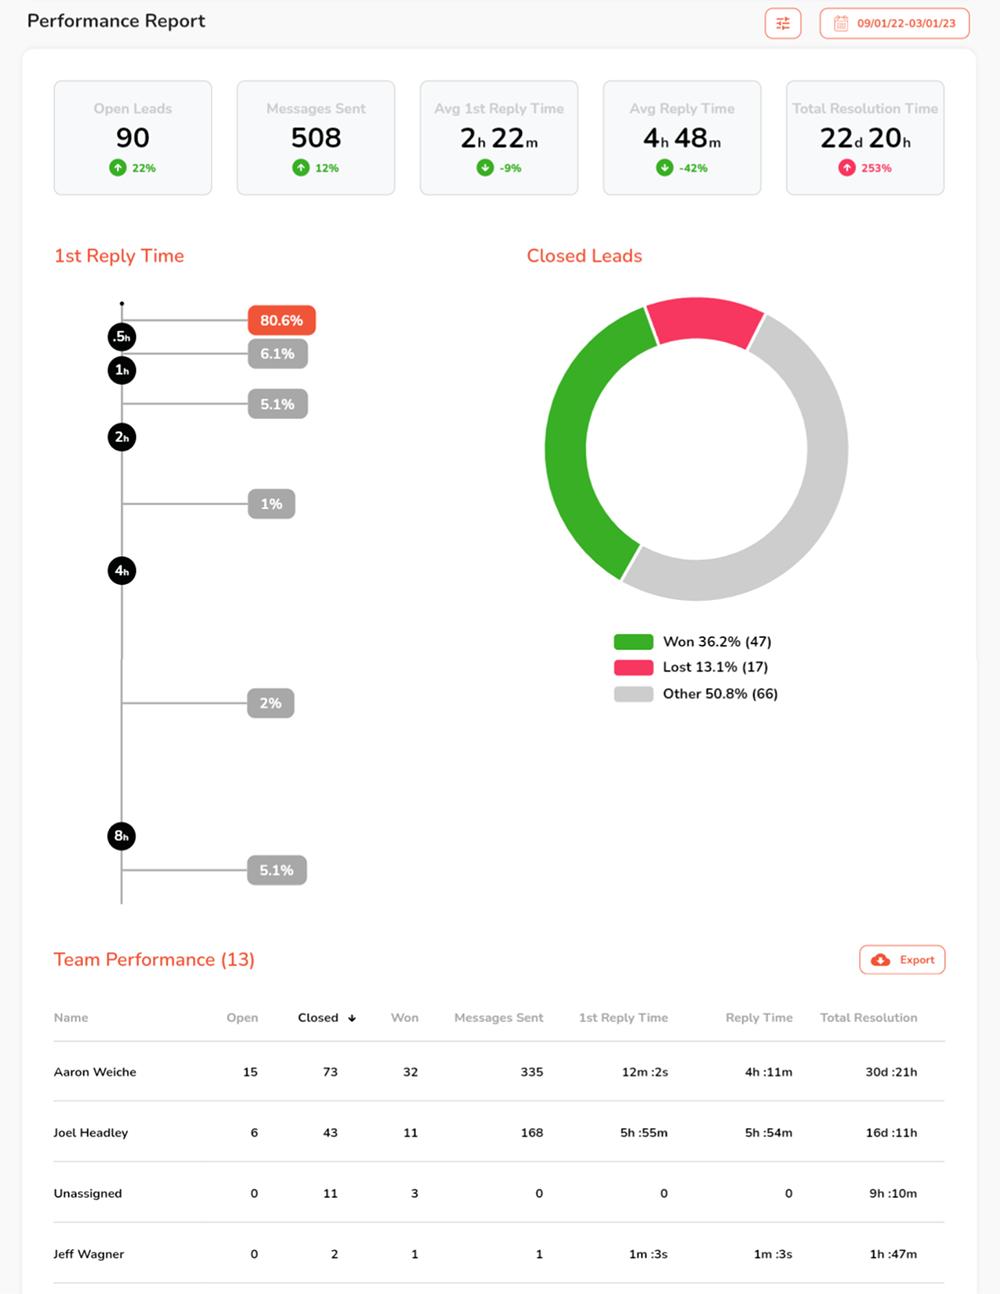
Report Summary
The top section of data is a summary of your account’s performance. This helps you understand the overall snapshot of your lead volume and response times.
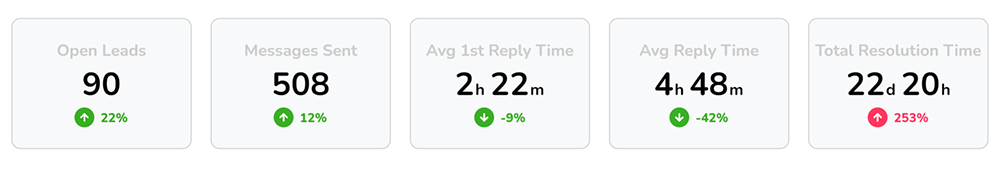
Each tile reports on the time frame you have selected for the account (unless filtered) and how it compares to that same previous time period.
- Open Leads – the number of current open leads in your account (last day of the report)
- Messages Sent – total number of messages sent in the report time frame
- Avg. 1st Reply Time – average time to first reply to a new lead from a team member (not the auto reply)
- Avg. Reply Time – average time of all reply messages from your team
- Total Resolution Time – average time of leads from new to closed
Each tile reports on the time frame you have selected for the account (unless filtered) and how it compares to that same previous time period.
For quantity tiles, green is an upward trend and red is down. For timing tiles (reply times), green is time reduction as you are getting faster (that’s the goal) and red is up.
1st Reply Time Timeline
The goal of the 1st Reply timeline is to be able to see where your team’s first replies fall. While the average 1st reply display gives you the median, this chart helps you understand what timeframe has the most and least replies.
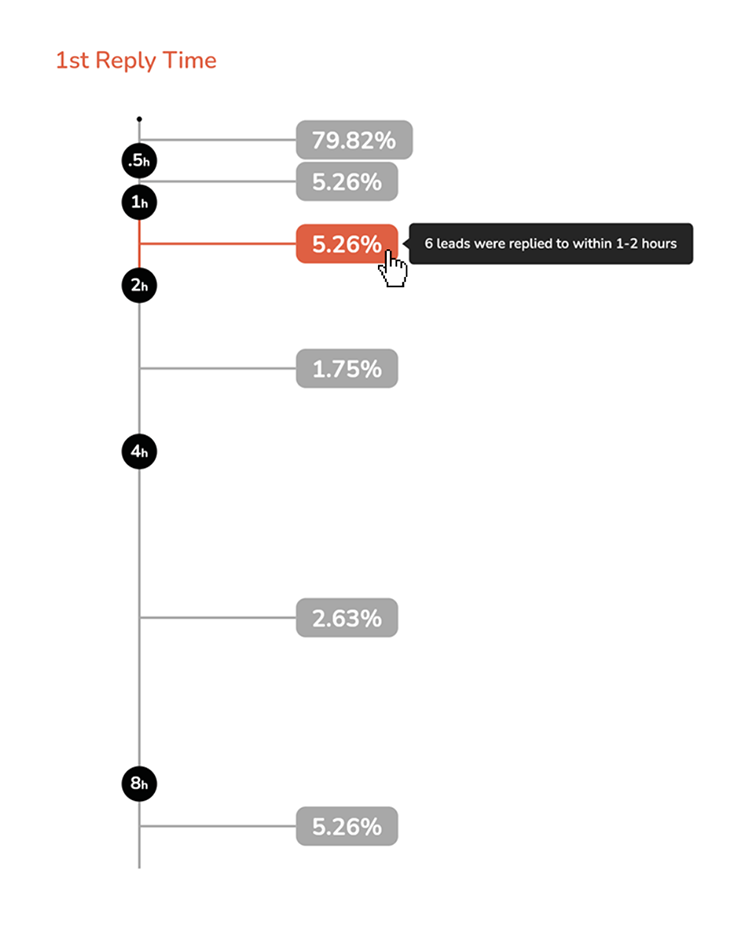
So while your average reply time might be two hours, it’s helpful to know that 79% of your first replies are within 30 minutes. Mousing over each percentage will tell you the total number of 1st replies in that timeframe.
Viewing all of your 1st replies in this timeline format lets you see where you are at and what goals to set to improve (further below you’ll see who can improve).
🏎️ Ready to track your speed of replies? We can help. Get your demo or free trial now.
Closed Leads Chart
This chart in the report gives you a visual of the quantity and percentage of your closed leads. Win, lost, or other is defined by your organization and communication goals. For one business it might be setting an appointment and for another it’s a signed agreement.
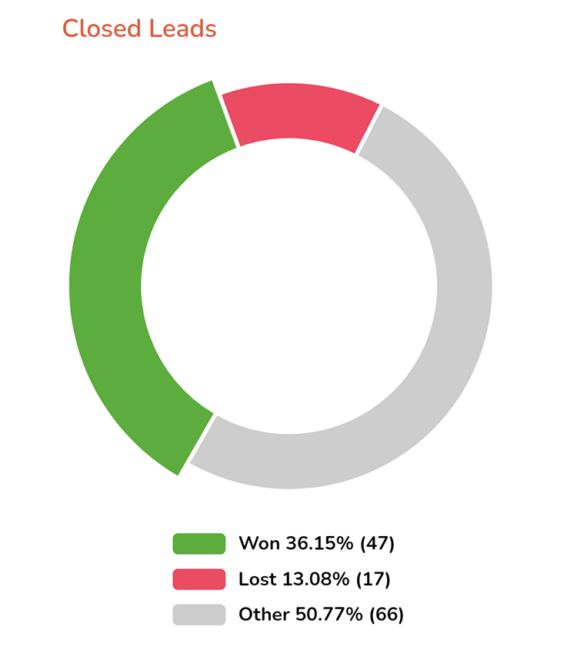
Regardless of how you use define your closed states, the importance of closing conversations is clear when it comes to reporting. It allows you to see the end result of your leads, in addition to keeping your Inbox “clean” and focused on conversations that need attention.
Team Performance
Now that you’ve viewed all of the averages and totals, the Team Performance table shows you how each team user in your account has performed to contribute to these numbers.
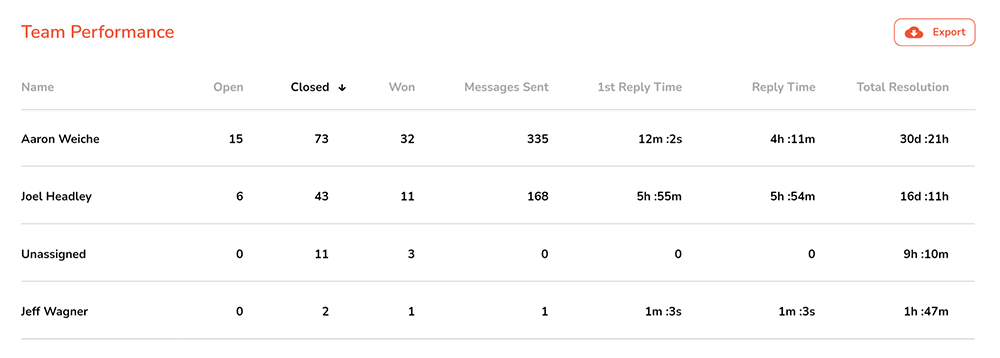
View performance data for each member of your team with columns you can sort in ascending or descending ordering by clicking on the column title (example above by Closed leads, most to least).
The data columns are:
- Open leads (open as of last day of report)
- Closed leads
- Won leads
- Messages sent
- Average 1st Reply Time
- Average Reply Time
- Average Total Resolution Time
This section also has the option to export the data in a CSV file you can view in Excel or Google Sheets.
Close more leads, faster
The Performance Report gives you the needed visibility to track your response times, set goals and improve. You further benefit from features already in Leadferno to automatically connect instantly with prospects and customers, communicate easily, and efficiently manage your lead process.
Now that you are able to focus on your speed of reply, you can use this data and reporting to improve your speed to lead and close more leads faster.
Similar posts you may be interested in:
Categories:
X - Close

Get our monthly update covering SMS, messaging, and Leadferno features.