The Lead Capture Report For Text Leads & Conversions
Track, report and improve your website conversions with Leaderno. Our Lead Capture Report tracks SMS leads, calls, forms, scheduling and more.
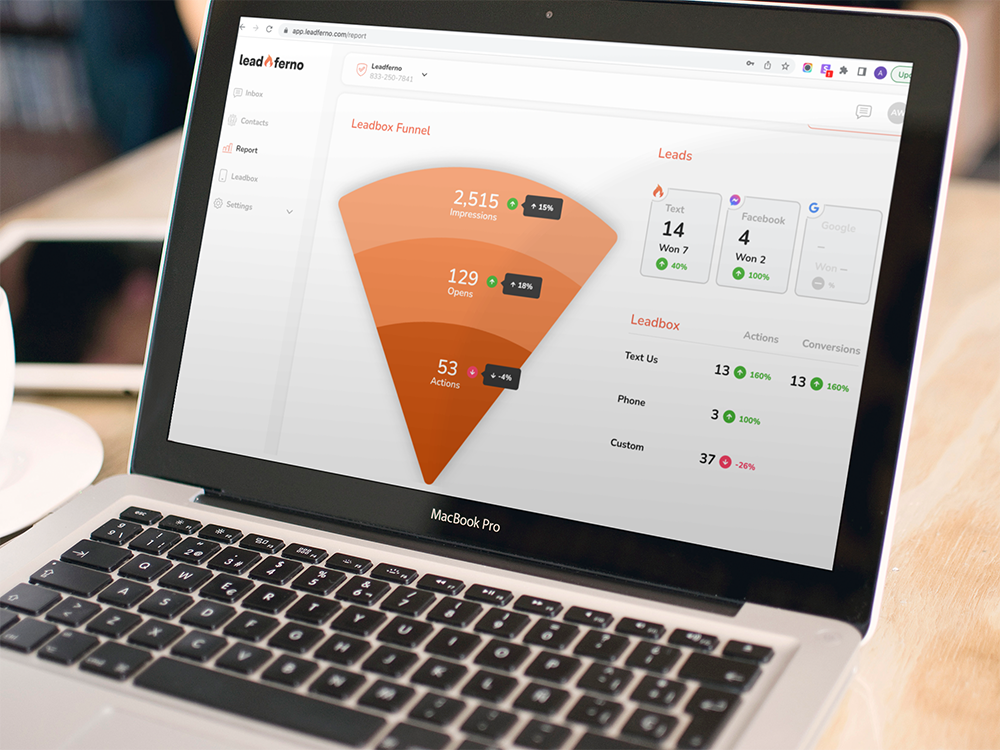
Tracking and measuring your contact channels and conversions in digital marketing is a must. Utilizing business messaging using SMS, Facebook Messenger, and Google Messaging to bring in more leads is even better when you can track all of it in one place. If you can’t measure it, then you can’t improve it.
Our newly launched Lead Capture Report helps you measure engagement, actions, and conversions across your top website pages and messaging channels.
Not only do we power your text and messaging, we track and report on these leads so you can evaluate and optimize your digital marketing.
Tracking Leads via Text
Foremost the Lead Capture Report was created to track your text messaging leads from your website through the Leadbox, our web-to-text widget. As a business text messaging platform, we are able to track your SMS leads all the way from interest to conversion.

While the focus is how your leads via text messaging are performing, it doesn’t stop there. Let’s take a look at everything the Lead Capture Report surfaces for you. This report is only available in our web app, not mobile.
Leadbox Funnel – Web-to-text Widget Performance
The Leadbox was designed to be your conversion hub. With options to focus on web-to-text conversations only, or offer visitors a number of options like calling you, emailing, forms, booking an appointment, and more.
The Leadbox Funnel is visually driven to help you understand your Leadbox performance.
- Impressions – the number of times the Leadbox widget loaded on the website
- Opens – the number of times the Leadbox was clicked or tapped open
- Actions – he number of times the a text message was submitted via the Leadbox or the number of actions or clicks on a custom channel button (call, book appointment, request info, etc.)
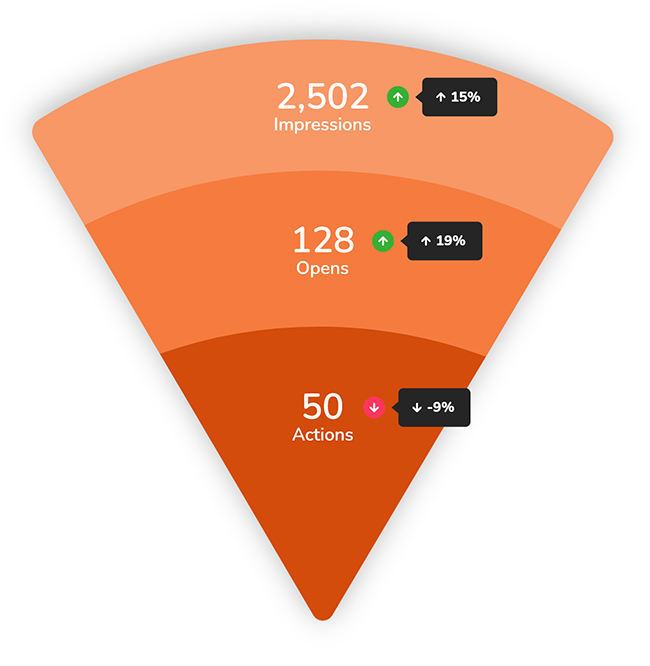
Mousing over the funnel will then display the comparison to the previous date range you are looking at and report the change. Above, the Leadbox Funnel shows 128 Leadbox opens in the last 30 days, which was 19% higher than the 30 days previous to that date range. This helps you understand the trends for each of these data points.
Actions are also reported in Google Analytics if you have integrated your GA account with Leadferno. They appear as the event labels submit-cta and phone, or custom.
🌧️ Make it rain lead data. To start tracking text leads, get a demo.
Leads – Conversions Across Channels
The Leads section reports the messaging channel sources for each lead appearing in Inbox. The messaging leads sources are Text (Leadbox or direct), Facebook Messenger, and Google Messaging (coming soon!).

The number of Won leads are those Leads that are closed and marked as Won. The lead creation date determines the lead count, not the date the lead was closed. The comparison percentage is reported so you can understand the trend for won leads from that channel.
Leadbox – User Actions and Conversions
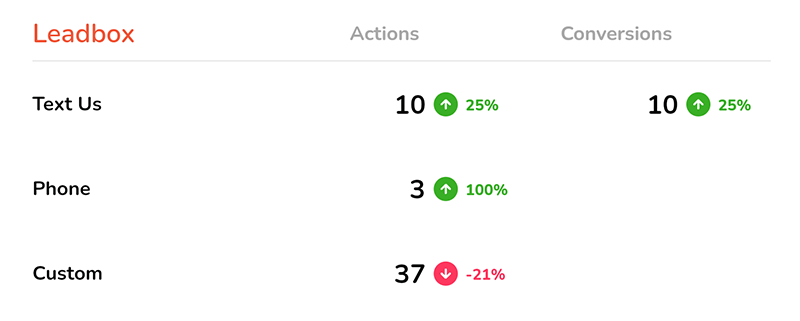
While the Leadbox funnel reports the total quantity of actions, the Leadbox section breaks them down by channel. We report what site visitors clicked or tapped on in your Leadbox. If you are using Text Only mode, you will only have data for the text row. If you are using Channels mode you will see data for the Custom or Phone channels you have selected.
Pages – Each Page Driving Leadbox Engagement & Conversions
The Pages section helps you understand what pages on your website are driving the most engagement with your Leadbox and calls-to-action. Each page is listed with the number of impressions, opens, actions, and conversions from the Leadbox.
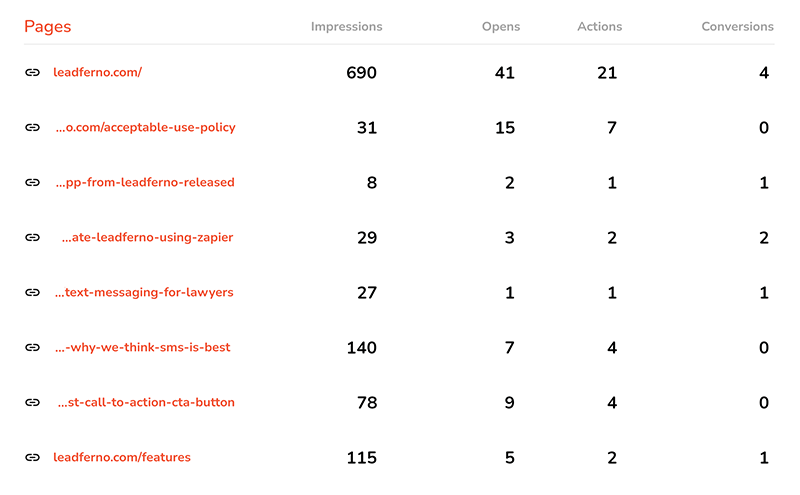
This section shows us that our home page is generating the most impressions with conversions at 3.8%, while our blog post on our Zapier app is producing a better conversion rate of 6.8%. We’d be smart to look at driving more traffic there to a higher converting page.
Our Leadbox channels include booking a demo and starting a free trial using our custom channels, recording in the report as Actions.
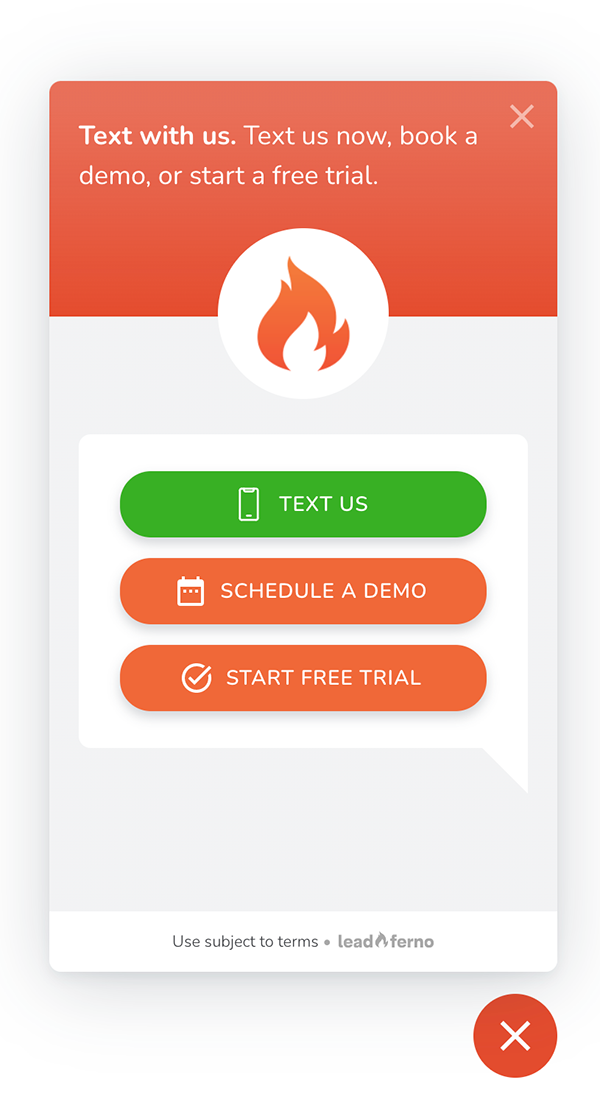
The actions column is any click in the Leadbox for texting, calls, or custom links/buttons. Conversions are only tracked for messages sent appearing in the your Leadferno Inbox since it is the only action we can track to completion.
Track, Report, and Optimize Your Messaging Leads
Now that you can track and see how your messaging leads are happening, you can make decisions to improve them. The Lead Capture Report brings a ton of visibility to your Leadbox’s performance and value.
Similar posts you may be interested in:
Categories:

Get our monthly update covering SMS, messaging, and Leadferno features.